
Dashboard
Learn All About the HighLevel Dashboard
What Is It?
The HighLevel Dashboard is typically the first screen you see when you log into HighLevel. It gives an overview report of activity in your account.
Watch the video to see an overview of the Dashboard and view details about the individual reports featured on the Dashboard by reading through the descriptions below.
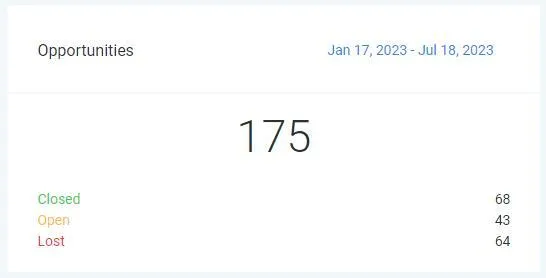
Opportunities Report
The Opportunities report card shows total Leads/Contacts listed in the Opportunities page.
Customize Dates: You can pull data based on custom start date and end date, based on when the lead originally came in.
Closed: Also referred to as "Won", the Closed leads are contacts that purchased and have been marked as Won.
Open: These are the leads that have not purchased or declined yet and are marked as Open.
Lost: These are the leads that have been marked as Lost, which generally means they decided not to purchase after an appointment or canceled services.
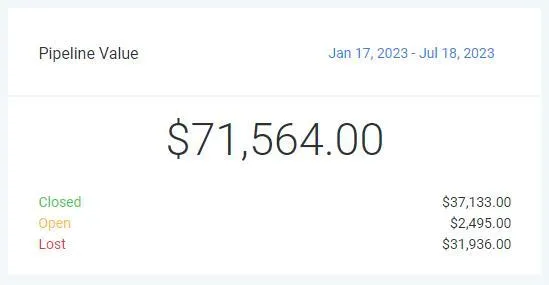
Pipeline Value Report
The Pipeline Value report card shows assigned values based on Status (Open, Won, Lost). You must assign a lead value to all leads for this card to update properly, this can be done automatically or manually.
Customize Dates: You can pull data based on custom start date and end date, based on when the lead originally came in.
Closed: Also referred to as "Won", the Closed leads are contacts that purchased and have been marked as Won.
Open: These are the leads that have not purchased yet or are not yet marked as Lost or Closed.
Lost: These are the leads that have been marked as Lost, which generally means they decided not to purchase after an appointment or canceled services.
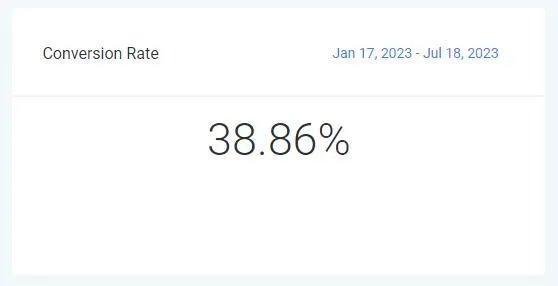
Conversion Rate Report
The Conversion Rate report card shows percentage of total leads that have been marked as "Won", meaning they purchased.
Customize Dates:
You can pull data based on custom start date and end date, based on when the lead originally came in.
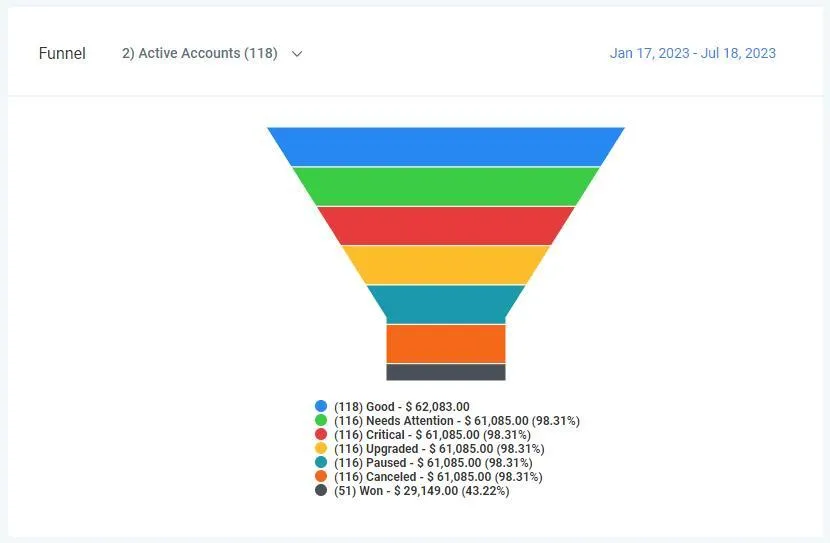
Funnel Report
The Funnel report card shows how many leads have moved through each column in Opportunities.
This Funnel report is most helpful if your Opportunities columns are setup as a full lifecycle of a lead-to-customer journey so you can track leads as they turn into customers.
If your Opportunities columns are not setup as a full lifecycle, then this Funnel report can be ignored.
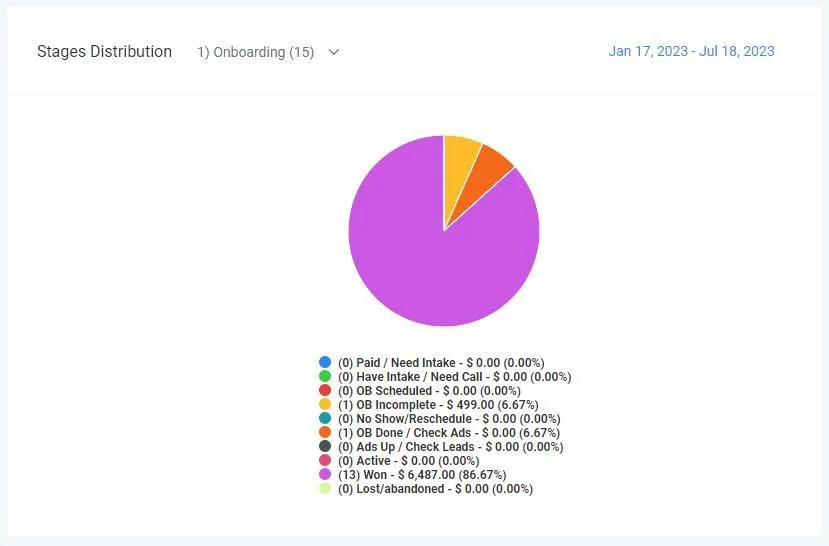
Stages Report
The Stages report card shows how many leads are currently in each column in Opportunities and their Status.
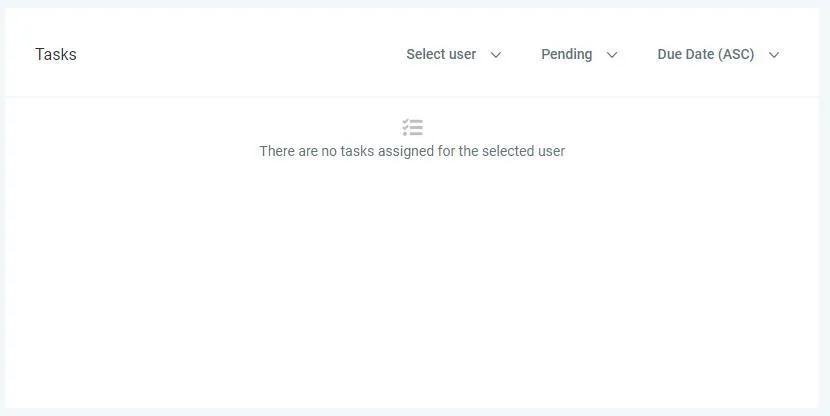
Tasks Report
The Tasks report card shows any task items assigned to you or other team members.
Select User: Select the user you wish to view tasks for, by default it will show tasks assigned to you first.
Pending: Update task status to filter as needed.
Due Date: Sort by ascending or descending.
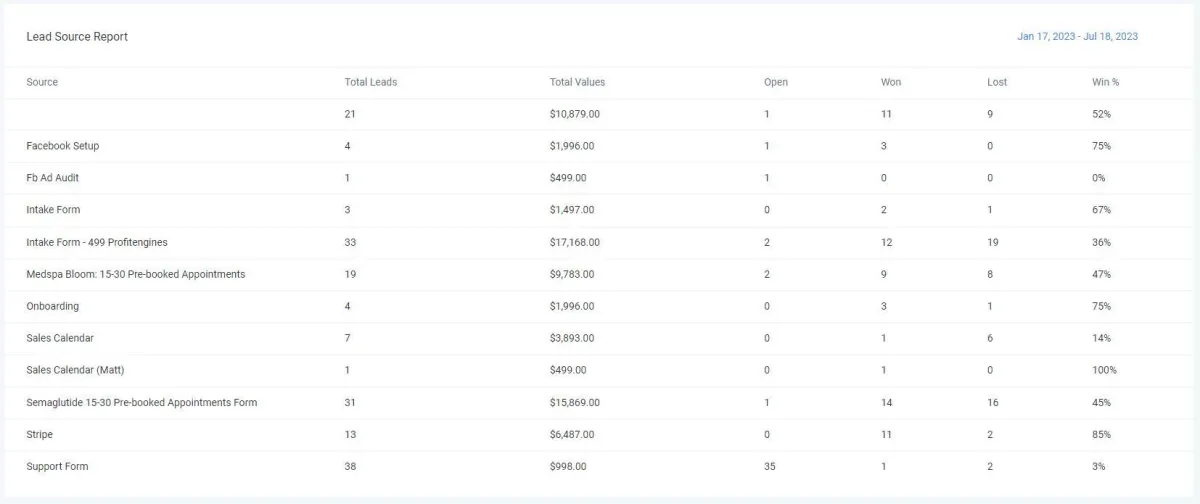
Lead Source Report
The Lead Source report card shows total leads/contact based on what is entered in the Source field on their profile. The Source field can be updated automatically or manually.
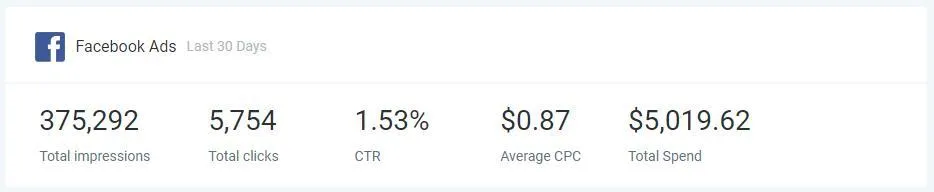
Facebook Ads Report
The Facebook Ads report card shows data pulled directly from Facebook Ads Manager if you have it integrated with your HighLevel account.
Total Impressions: How many people have seen your ads.
Total Clicks: How many people have clicked on your ads.
CTR: Click-through rate - how many people have clicked through to your website (if your ad is linked to your site).
Average CPC: Cost-per-click - total ad spend divided by total click throughs.
Total Spend: Total cost of ads for the last 30 days.
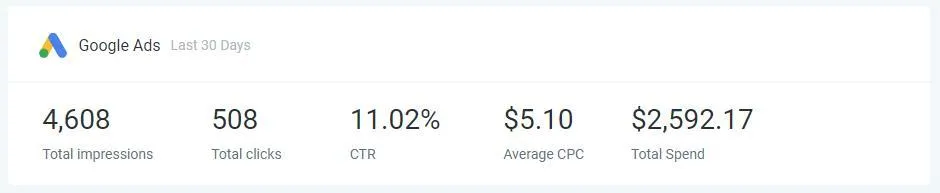
Google Ads Report
The Google Ads report card shows data pulled directly from Google Ads Manager if you have it integrated with your HighLevel account.
Total Impressions: How many people have seen your ads.
Total Clicks: How many people have clicked on your ads.
CTR: Click-through rate - how many people have clicked through to your website (if your ad is linked to your site).
Average CPC: Cost-per-click - total ad spend divided by total click throughs.
Total Spend: Total cost of ads for the last 30 days.
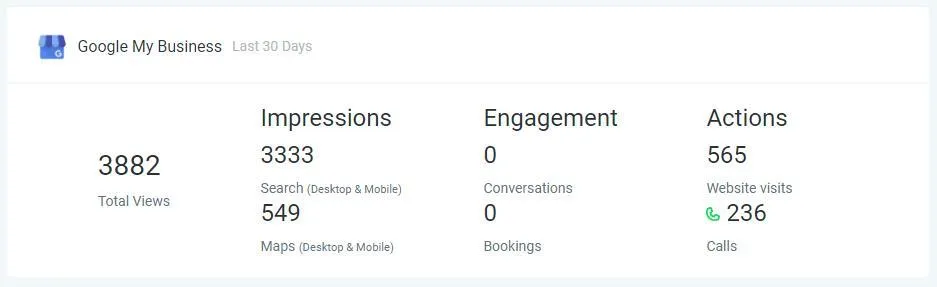
Google My Business Report
The Google My Business (GMB) report card shows data from your Google business profile (also sometimes referred to as your Google Maps listing).
Impressions: How many people have seen your GMB profile.
Engagement: How many people have clicked on your GMB profile. You must have messaging and online booking features enabled on your GMB profile to use these features.
Actions: How many people visited your website or called you from your GMB profile.
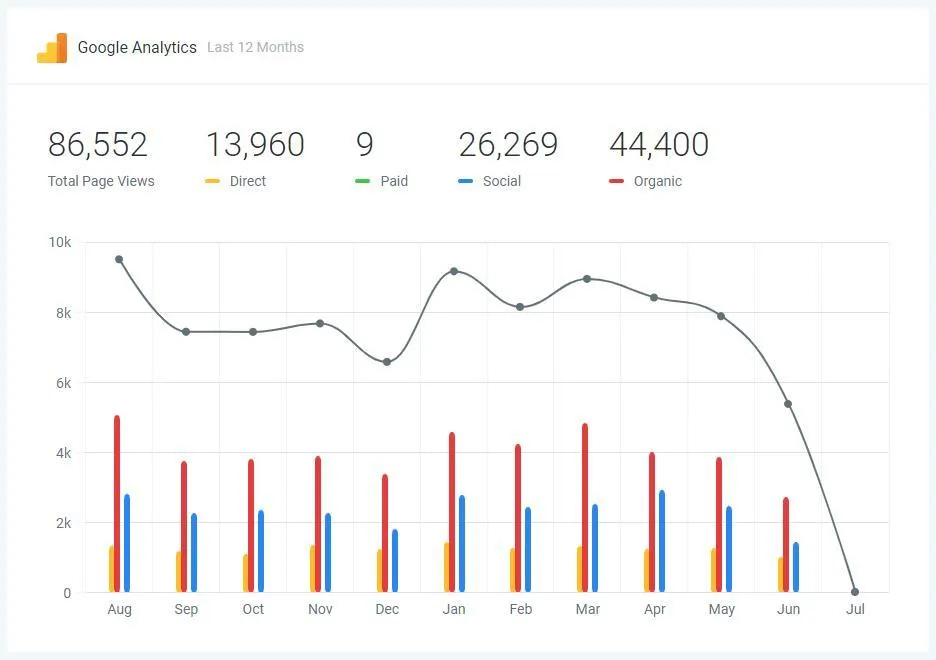
Google Analytics Report
The Google Analytics report card shows reporting directly from your Google Analytics account if you have it integrated with your HighLevel account.
Total Page Views: How many times your website has been viewed.
Direct: How many people clicked a link to go directly to your website (links from other websites, email signatures, email marketing, etc)
Paid: How many people clicked a Google Ad to go to your website.
Social: How many people clicked a link to your website from Facebook, Instagram, or any other social platform.
Organic: How many people visited your site from a search engine (Google, Bing, Yahoo, etc)

© 2024 MedspaBloom LLC - All Rights Reserved